Debugging Applications running within Central
Because applications running within Central use the Central API and because those APIs are not available within the Flash Authoring environment, you have to test and debug your applications within Central itself. This is actually pretty simple, and you can use the trace() statement like your normally would.
There are two main steps to testing and debugging within the Central environment. The first is publishing a new SWF directly into Central. This is possible once you have installed your application into Central. The second is viewing runtime debug / trace information from the application.
Publishing directly into the Central Environment
- Find the location where you application files were installed by Central. On Windows this will
be similar to: C:\Documents and Settings\USERNAME\Application
Data\Macromedia\Central\DOMAINNAME\APPNAME . On Mac, this will be similar to:
Hard Drive/Users/USERNAME/Library/Application Support/Macromedia/Central/
DOMAINNAME/APPNAME/ - Open your application within the Flash Authoring Environment.
- Open the Publish Settings Dialog (File > Publish Settings).
- Set the file to Publish into the directory located above. Make sure that the file is published with
the same file name that was installed by Central. - Save the settings, by clicking OK.
To test your application, you must publish it (File > Publish). This will compile the SWF into its
application directory within Central. You can then view the updated application file by switching
to Central and reloading the application by switching to another application within Central and
then switching back. If you are testing a Pod, you must close the pod and reopen it. If you are
testing an Agent, you must restart Central.
Once the application is running within the Central environment, you can use the Central Debug
Panel to view runtime debug information from the application. The Central Debug Panel runs
within the Flash Authoring environment, and can be installed from the SDK.
To install the Central Debug Panel
- Make sure you have the Macromedia Extension Manager installed. You can download the
Extension Manager from here. - Locate the CentralDebug.mxp file in the Utilities\DebugPanel subdirectory under the SDK
directory. - Open the CentralDebug.mxp file in the Macromedia Exchange Manager to install the panel
automatically in the Macromedia Flash authoring tool.
Using the Debug Panel
- Open the debug panel in the Flash Authoring Environment. In Flash MX it is located in the
- Windows > Central Debug Panel* menu. In Flash MX 2004 it can be located in the *Windows
Other Panels > Central Debug Panel*.
- Make sure that “Omit trace actions” is not checked in the public settings (File > Publish Settings > Flash).
- Add
debug.enabled = true;to your application. This will enabled debugging. - Add trace statements to your application. You can pass in various data types including strings,
objects and arrays. - Test your application within Central. Any trace statements encounter during the application runtime will be printed out into the Debug Panel within the Flash Authoring Environment.
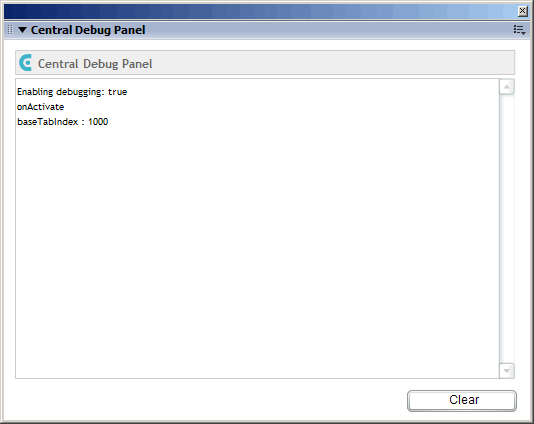
Here is an example onActivate method:
onActivate = function(shell, appId, shellId, baseTabIndex, initialData)
{
	debug.enabled = true;

	trace("onActivate");
	trace("baseTabIndex : " + baseTabIndex);
}
Here is what gets printed to the debug panel:

Note, the Central Debug Panel on the SDK is a beta version. If it doesn’t appear to be working, you may have to close and then reopen it.


